This is my first Keras application. It attempts to classify the Iris dataset. Based of of an online tutorial1
Git
https://github.com/Tzeny/iris-classifier
Code
import matplotlib.pyplot as plt
import seaborn as sns
import numpy as np
from sklearn.cross_validation import train_test_split
from sklearn.linear_model import LogisticRegressionCV
from keras.models import Sequential
from keras.layers.core import Dense, Activation
from keras.utils import np_utils
from keras.utils import plot_model
import time
max_epoch=200
date = time.strftime('%Y-%m-%d-%H:%M')
def one_hot_encode_object_array(arr):
'''One hot encode a numpy array of objects (e.g. strings)'''
uniques, ids = np.unique(arr, return_inverse=True)
return np_utils.to_categorical(ids, len(uniques))
iris = sns.load_dataset("iris")
X = iris.values[:, 0:4]
y = iris.values[:, 4]
train_X, test_X, train_y, test_y = train_test_split(X, y, train_size=0.5, random_state=0)
train_y_ohe = one_hot_encode_object_array(train_y)
test_y_ohe = one_hot_encode_object_array(test_y)
global_scores =
global_loss =
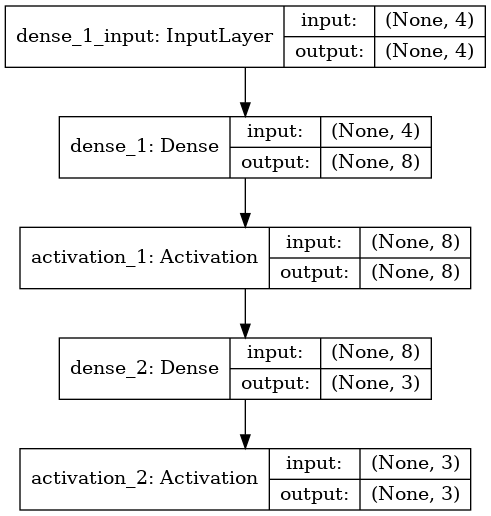
model = Sequential()
model.add(Dense(8, input_shape=(4,)))
model.add(Activation('sigmoid'))
model.add(Dense(3))
model.add(Activation('softmax'))
model.compile(loss='categorical_crossentropy', optimizer='adam', metrics=['accuracy'])
plot_model(model, to_file=date+'_model.png', show_shapes=True)
highest_score = 0
#train one epoch and evaluate the model
for i in range(0,max_epoch):
model.fit(train_X, train_y_ohe, verbose=1, epochs=1, batch_size=1)
scores = model.evaluate(test_X, test_y_ohe)
print(model.metrics_names)
print("%s: %.2f%%" % (model.metrics_names1, scores1*100))
if scores1*100 > highest_score:
highest_score = scores1*100
global_scores.append(scores1*100)
global_loss.append(scores0*100)
print("Best score: " + str(highest_score))
x = [l for l in range(0,max_epoch)]
#plt.plot(x)
line_up, = plt.plot(global_scores, label='Accuracy')
line_down, = plt.plot(global_loss, label='Loss')
plt.legend(handles=[line_up, line_down])
#plt.plot(x, global_scores, global_loss)
plt.xlabel('Epoch')
plt.text(0,0,'Max epochs ' + str(max_epoch) + ';' + date, fontsize=6)
plt.savefig(date+'_score.png', bbox_inches='tight')
I used code from this article2 to make the program correctly display accuracy.
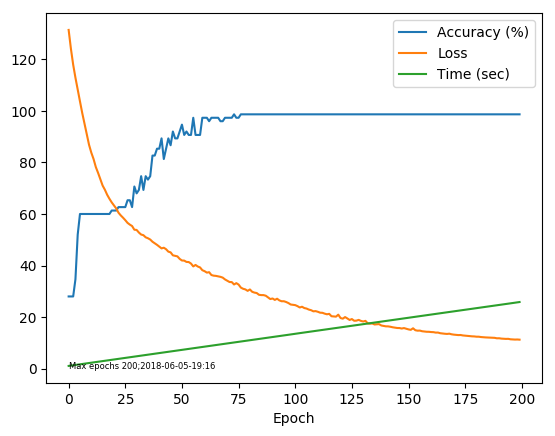
Using the above code I trained to model for 200 epochs, and plotted on a graph the accuracy and loss obtained by evaluating the model at each epoch.
This is the model: