I’ll use hypothesis and model interchangeably in the writing below.
Some ideas to try out when debugging ML algorithms:
- Increase the size of the training set - fixes high variance
- Decrease number of features - fixes high variance
- Try getting more features - fixes high bias
- Add polynomial features - fixes high bias
- Increase lambda - fixes high bias
- Decrease lambda - fixes high variance
Training, cross validation, test
Split your training set into:
- training set 70%
- test set 30%
Train on training set, check on test set.
To evaluate different hypotheses:
- training set 60%
- cross validation set 20%
- test set 20%
Train different hypotheses on training set, after that use the cross validation set to pick the best hypothesis, check on test set
Bias vs Variance
If your training error and cross validation error are high, algorithm probably suffers from biasing (underfitting)
If you cross validation error is much larger than your training error which is small, algorithm probably suffers from high variance (overfitting)
In a High bias scenario, getting more training examples would not help. In a high variance scenario more training examples might help.
Precision and recall
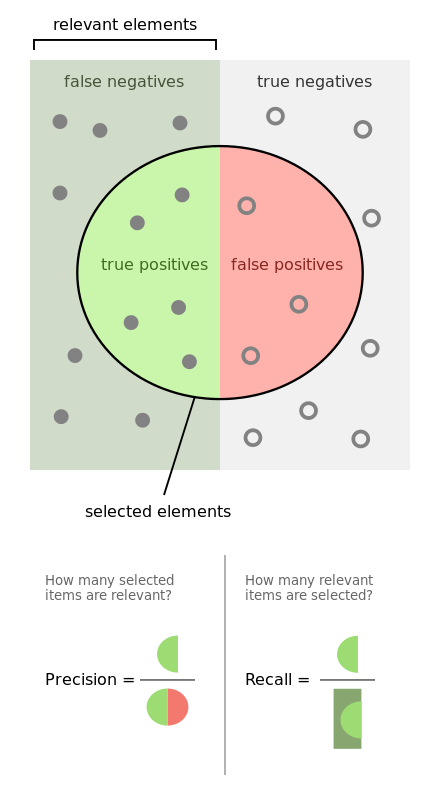
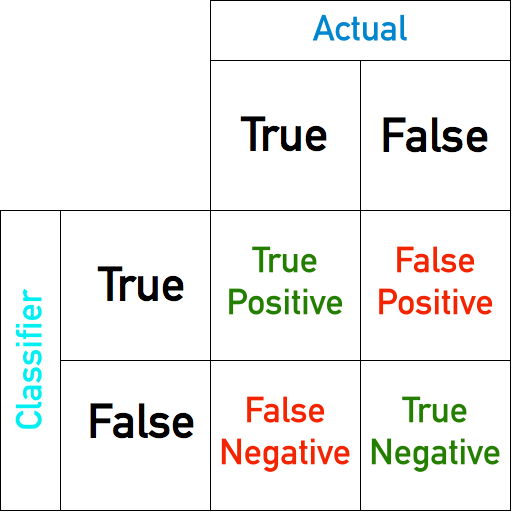
$\text{Precision} = \frac{\text{True positives}}{\text{True positives} + \text{False positives}} = \frac{\text{True positives}}{\text{Predicted positive}}$ (of all our true predictions, how many are true?)
$\text{Recall} = \frac{\text{True positives}}{\text{True positives} + \text{False negatives}} = \frac{\text{True positives}}{\text{Actual positive}}$ (of all the truths, how many did we predict?)
$\text{Accuracy} = \frac{\text{True positives} + \text{True negatives}}{\text{Total number of examples}} = \frac{\text{Correct predictions}}{\text{Number of predictions}}$ (of all the examples, how many did we accurately classify?) If we modify our classifier’s threshold there are 2 possible scenarios:
- increased threshold -> higher precision, lower recall (lower number of false positives)
- decreased threshold -> lower precision, higher recall (lower number of false negatives)
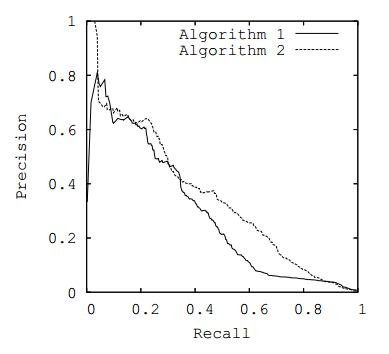
F1 score
To help choose the right algorithm based on precision and recall we can use the F1 score.
$F1 = 2 * \frac{P * R}{P + R}$
from sklearn.metrics import accuracy_score,classification_report
print("The accuracy train score is {:0.3f}".format(accuracy_score(y_train, y_train_pred)))
print(classification_report(y_train, y_train_pred)) #to print precision, recall and F1

print("The accuracy test score is {:0.3f}".format(accuracy_score(y_test, y_test_pred)))
print(classification_report(y_test, y_test_pred))
Learning Rate
Choosing a right learning rate (lambda)
If we pick a small learning rate we risk overfitting, if we pick a high learning rate we risk underfitting.
We should train our model with several different learning rates and then choose our cross validation error to pick the best one.
Cross Entropy
S is the softmax output of the Neural Network for input xi. L is the hot encoded vector corresponding to label yi. D(S, L)= − ∑iLilog*(*Si)
How to improve a classifier
- Collect lots of data (for example “honeypot” project but doesn’t always work)
- Develop sophisticated features (for example: using email header data in spam emails)
- Develop algorithms to process your input in different ways (recognizing misspellings in spam).
The recommended approach to solving machine learning problems is to:
- Start with a simple algorithm, implement it quickly, and test it early on your cross validation data.
- Plot learning curves to decide if more data, more features, etc. are likely to help.
- Manually examine the errors on examples in the cross validation set and try to spot a trend where most of the errors were made.
Get a number representing the performance of your algorithm (accuracy on the cross validation set for instance).
Learning curve
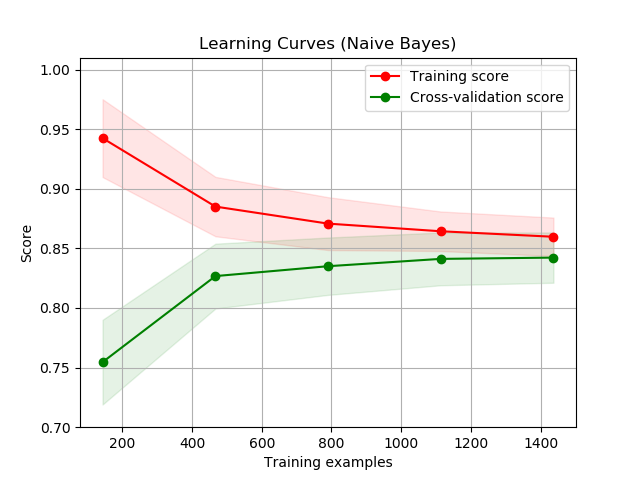
A learning curve can be a useful tool in determining whether we should spend more time improving the model or collecting additional data. We split our training set into n sets (first set having 1/n% of the examples in the training set, second have 2/n% etc.), we train our algorithm on each of them, and then plot it’s accuracy on the test set.
If the score on the test set keeps getting better we need more training examples. If it plateaus we need to improve our algorithm.
Adjusting the learning rate during training1
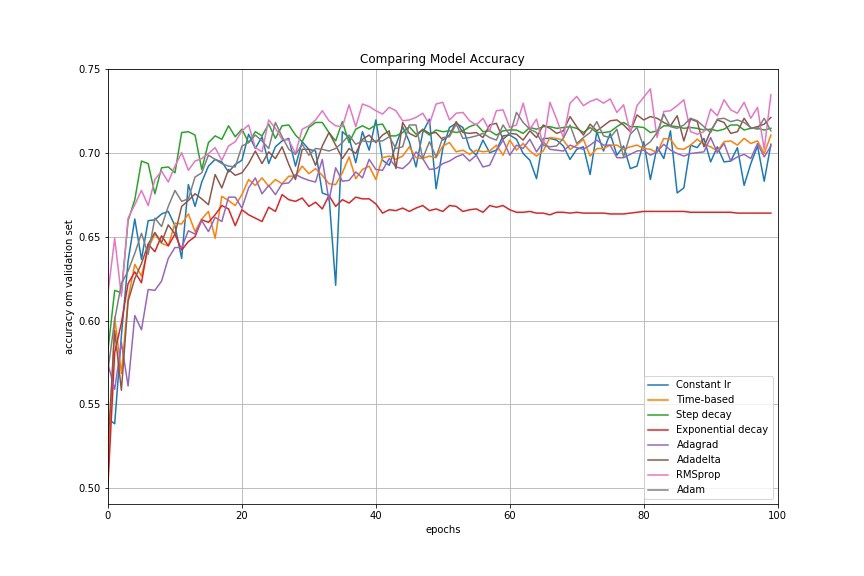
We can either use:
- learning rate schedules - modifying the learning rate in a fixed way at every n steps
- adaptive learning rate algorithms - such asAdaGrad,AdaDelta,Adam
Adaptive learning rate algorithms should do a better job since they are not problem specific like tuning the learning rate decay manually would be.
Learning rate and number of epochs
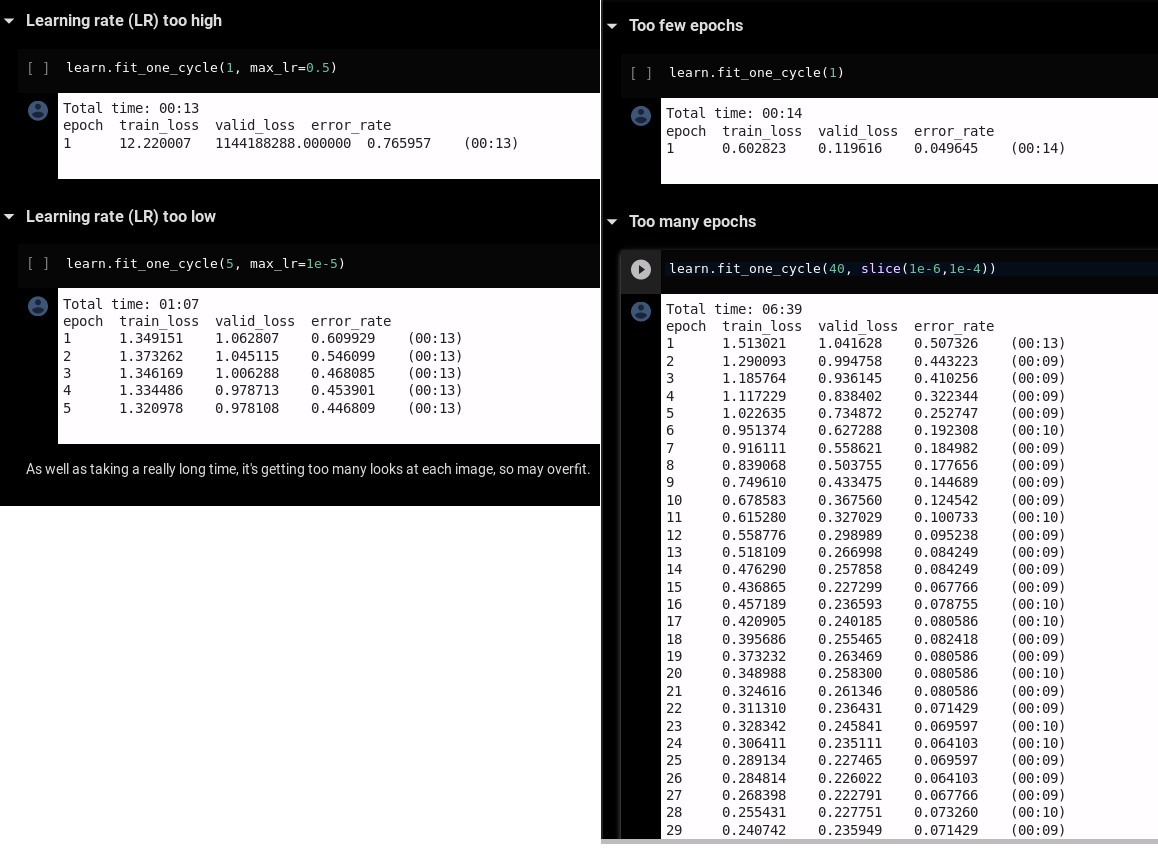
If you set your learning rate too high, you model will have a validation loss » training loss.
If you set it too low, training loss < validation loss; set it higher or train for more epochs.
If you do not train for enough epochs, training loss < validation loss.